Spatial perturbation tasks on mouse brain data
[1]:
import os
import sys
sys.path.append("../")
device = "cuda"
import importlib
[2]:
import scanpy as sc
import squidpy as sq
import pandas as pd
from tqdm.notebook import tqdm
import scipy as sp
import numpy as np
import multiprocessing
import pickle as pkl
import torch
import gc
import sklearn.metrics

import matplotlib.pyplot as plt
import seaborn as sns
import matplotlib
matplotlib.rcParams['mathtext.fontset'] = 'dejavuserif'
matplotlib.rcParams['font.family'] = 'arial'
matplotlib.rc('pdf', fonttype=42)
C:\Users\lshh\miniconda3\envs\py311_torch211_cuda121\Lib\site-packages\dask\dataframe\_pyarrow_compat.py:15: FutureWarning: Minimal version of pyarrow will soon be increased to 14.0.1. You are using 11.0.0. Please consider upgrading.
  warnings.warn(
[3]:
import steamboat as sf
import steamboat.tools
[4]:
import torch
[5]:
adata = sc.read_h5ad("saved_h5ad/mmbrain_0.h5ad")
[6]:
model = sf.Steamboat(adata.var_names.tolist(), n_heads=50, n_scales=3)
model = model.to(device)
model.load_state_dict(torch.load('saved_models/mmbrain.pth', weights_only=True), strict=False)
C:\Users\lshh\miniconda3\envs\py311_torch211_cuda121\Lib\site-packages\torch\_utils.py:831: UserWarning: TypedStorage is deprecated. It will be removed in the future and UntypedStorage will be the only storage class. This should only matter to you if you are using storages directly.  To access UntypedStorage directly, use tensor.untyped_storage() instead of tensor.storage()
  return self.fget.__get__(instance, owner)()
[6]:
_IncompatibleKeys(missing_keys=[], unexpected_keys=['spatial_gather.w_local._scale', 'spatial_gather.w_global._scale'])
[7]:
import importlib
importlib.reload(steamboat.tools)
[7]:
<module 'steamboat.tools' from 'G:\\Projects\\Steamboat\\examples\\..\\steamboat\\tools.py'>
[8]:
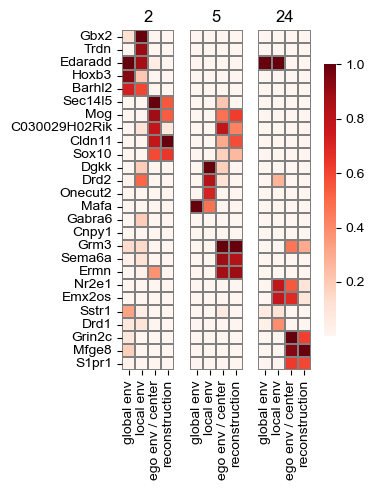
model.features = adata.var['gene_symbol']
sf.tools.plot_all_transforms(model, top=3, head_order=[2, 5, 24], figsize=(4, 5))
# # plt.savefig(fig_path + "crc_all_loadings.pdf", bbox_inches='tight')
['Gbx2' 'Trdn' 'Edaradd' 'Hoxb3' 'Barhl2' 'Sec14l5' 'Mog' 'C030029H02Rik'
 'Cldn11' 'Sox10' 'Dgkk' 'Drd2' 'Onecut2' 'Mafa' 'Gabra6' 'Cnpy1' 'Grm3'
 'Sema6a' 'Ermn' 'Nr2e1' 'Emx2os' 'Sstr1' 'Drd1' 'Grin2c' 'Mfge8' 'S1pr1']
Spatial perturbation scenario 1: transplanting cells
Designate cells to be “transplanted”
[9]:
# Find OPC-Oligo in two regions

adata.obs['class_region'] = adata.obs['class'].astype(str) + '@' + adata.obs['parcellation_division'].astype(str)
adata.obs['oligo_class_region'] = adata.obs['class_region']
adata.obs.loc[adata.obs['class_region'] != '31 OPC-Oligo', 'oligo_class_region'] = '98 Other'
[10]:
# Confirm that there are some expression differences in OPC-Oligo in two regions.

oligo_adata = adata[adata.obs['class_region'].isin(['31 OPC-Oligo@Isocortex', '31 OPC-Oligo@HPF'])]
[11]:
oligo_adata.obs['class_region'].value_counts()
[11]:
class_region
31 OPC-Oligo@HPF          980
31 OPC-Oligo@Isocortex    784
Name: count, dtype: int64
[12]:
sc.tl.rank_genes_groups(oligo_adata, groupby='class_region', reference='31 OPC-Oligo@Isocortex', method='wilcoxon')
C:\Users\lshh\miniconda3\envs\py311_torch211_cuda121\Lib\site-packages\anndata\_core\anndata.py:1292: ImplicitModificationWarning: Trying to modify attribute `.obs` of view, initializing view as actual.
  df[key] = c
C:\Users\lshh\miniconda3\envs\py311_torch211_cuda121\Lib\site-packages\anndata\_core\anndata.py:1292: ImplicitModificationWarning: Trying to modify attribute `.obs` of view, initializing view as actual.
  df[key] = c
C:\Users\lshh\miniconda3\envs\py311_torch211_cuda121\Lib\site-packages\numpy\core\fromnumeric.py:86: FutureWarning: The behavior of DataFrame.sum with axis=None is deprecated, in a future version this will reduce over both axes and return a scalar. To retain the old behavior, pass axis=0 (or do not pass axis)
  return reduction(axis=axis, out=out, **passkwargs)
[13]:
sc.get.rank_genes_groups_df(oligo_adata, group='31 OPC-Oligo@HPF')
[13]:
| names | scores | logfoldchanges | pvals | pvals_adj | |
|---|---|---|---|---|---|
| 0 | ENSMUSG00000020932 | 13.187178 | 2.604712 | 1.040073e-39 | 1.166962e-36 |
| 1 | ENSMUSG00000090291 | 5.466264 | 4.215365 | 4.596197e-08 | 6.446167e-06 |
| 2 | ENSMUSG00000023913 | 3.856600 | 0.769698 | 1.149752e-04 | 9.146835e-03 |
| 3 | ENSMUSG00000031980 | 3.806837 | 2.439926 | 1.407553e-04 | 9.870467e-03 |
| 4 | ENSMUSG00000053930 | 3.645979 | 2.021932 | 2.663758e-04 | 1.758080e-02 |
| ... | ... | ... | ... | ... | ... |
| 1117 | ENSMUSG00000058624 | -6.016663 | -1.100518 | 1.780497e-09 | 3.329530e-07 |
| 1118 | ENSMUSG00000033730 | -6.205130 | -2.224680 | 5.465168e-10 | 1.226384e-07 |
| 1119 | ENSMUSG00000070570 | -6.513019 | -0.717460 | 7.365549e-11 | 2.066036e-08 |
| 1120 | ENSMUSG00000047907 | -6.625102 | -2.285636 | 3.470090e-11 | 1.297814e-08 |
| 1121 | ENSMUSG00000005583 | -10.971990 | -2.906106 | 5.211266e-28 | 2.923520e-25 |
1122 rows × 5 columns
[14]:
old_adata = adata.copy()
new_adata = adata.copy()
[15]:
sq.pl.spatial_scatter(old_adata, color='parcellation_division', shape=None, figsize=(5, 5), size=1., lw=0., legend_fontsize=9, title="", frameon=False)
WARNING: Please specify a valid `library_id` or set it permanently in `adata.uns['spatial']`
C:\Users\lshh\miniconda3\envs\py311_torch211_cuda121\Lib\site-packages\squidpy\pl\_spatial_utils.py:946: UserWarning: No data for colormapping provided via 'c'. Parameters 'cmap', 'norm' will be ignored
  _cax = scatter(

[16]:
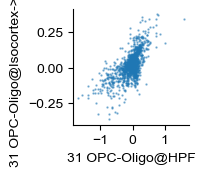
repalcement_class = '31 OPC-Oligo@Isocortex'
to_be_replaced_class = '31 OPC-Oligo@HPF'
new_name = '31 OPC-Oligo@Isocortex->HPF'

n = 200
np.random.seed(0)
replacement = np.random.choice(np.where(new_adata.obs['class_region'] == repalcement_class)[0], n, replace=False)
to_be_replaced = np.random.choice(np.where(new_adata.obs['class_region'] == to_be_replaced_class)[0], n, replace=False)
Reconstruct the gene expression
[17]:
new_adata.X[to_be_replaced, :] = new_adata.X[replacement, :]
new_adata.obs['class2'] = new_adata.obs['class_region'].tolist()
new_adata.obs.loc[new_adata.obs_names[to_be_replaced], 'class2'] = new_name

new_dataset = sf.make_dataset([new_adata], sparse_graph=True, regional_obs=['global'])
sf.tools.calc_obs([new_adata], new_dataset, model, get_recon=True)
new_adata.X = new_adata.obsm['X_recon']
Using ['global'] as regional annotations.
Perform DE analysis
[18]:
highlight = [repalcement_class, new_name, to_be_replaced_class]
sc.tl.rank_genes_groups(new_adata, groupby='class2', groups=highlight, reference=repalcement_class, method='wilcoxon')
C:\Users\lshh\miniconda3\envs\py311_torch211_cuda121\Lib\site-packages\numpy\core\fromnumeric.py:86: FutureWarning: The behavior of DataFrame.sum with axis=None is deprecated, in a future version this will reduce over both axes and return a scalar. To retain the old behavior, pass axis=0 (or do not pass axis)
  return reduction(axis=axis, out=out, **passkwargs)
[19]:
a_df = pd.merge(sc.get.rank_genes_groups_df(new_adata, group=to_be_replaced_class), new_adata.var, right_index=True, left_on='names')
b_df = pd.merge(sc.get.rank_genes_groups_df(new_adata, group=new_name), new_adata.var, right_index=True, left_on='names')
ab_df = pd.merge(a_df, b_df, left_on='names', right_on='names')
[20]:
matplotlib.rcParams['mathtext.fontset'] = 'dejavuserif'
matplotlib.rcParams['font.family'] = 'arial'
matplotlib.rc('pdf', fonttype=42)

fig, ax = plt.subplots(figsize=(1.5, 1.5))
ab_df.plot(kind='scatter', x='logfoldchanges_x', y='logfoldchanges_y', s=0.5, ax=ax, alpha=.5)
ax.set_xlabel(to_be_replaced_class)
ax.set_ylabel(new_name)

for pos in ['right', 'top']:
        plt.gca().spines[pos].set_visible(False)

# plt.savefig(savefig_path + "mmbrain_perturbation_logfc.pdf", bbox_inches='tight', transparent=True)
[21]:
ab_df2 = ab_df[~ab_df['logfoldchanges_x'].isna() & ~ab_df['logfoldchanges_y'].isna()]
sp.stats.spearmanr(ab_df2['logfoldchanges_x'], ab_df2['logfoldchanges_y'])
[21]:
SignificanceResult(statistic=0.6419909066233113, pvalue=2.277434802943895e-131)
[22]:
ab_df[['logfoldchanges_x', 'logfoldchanges_y']].corr(method='spearman')
[22]:
| logfoldchanges_x | logfoldchanges_y | |
|---|---|---|
| logfoldchanges_x | 1.000000 | 0.641991 |
| logfoldchanges_y | 0.641991 | 1.000000 |
[23]:
ab_df[['logfoldchanges_x', 'logfoldchanges_y']].corr(method='pearson')
# 0.475
[23]:
| logfoldchanges_x | logfoldchanges_y | |
|---|---|---|
| logfoldchanges_x | 1.000000 | 0.680731 |
| logfoldchanges_y | 0.680731 | 1.000000 |
Spatial perturbation scenario 2: changing environment.
Overview the variability of expression of genes
[38]:
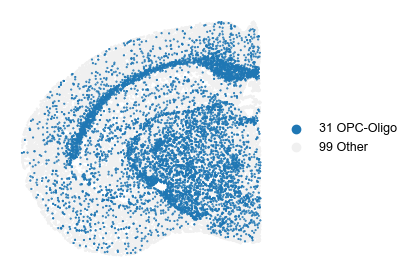
adata_rearrange = adata[np.where(~adata.obs['class'].isin(['31 OPC-Oligo']))[0].tolist() +
                        np.where(adata.obs['class'].isin(['31 OPC-Oligo']))[0].tolist()]
adata_rearrange.obs['class'] = adata_rearrange.obs['class'].astype(str)
adata_rearrange.obs.loc[adata_rearrange.obs['class'] != '31 OPC-Oligo', 'class'] = '99 Other'
sq.pl.spatial_scatter(adata_rearrange, color='class', shape=None, figsize=(4, 4), size=1., legend_fontsize=9, title="", frameon=False,
                      palette=matplotlib.colors.ListedColormap(['C0', '#f0f0f0']))
# plt.savefig(savefig_path + "mmbrain_KO_scheme.pdf", bbox_inches='tight', transparent=True)
C:\Users\lshh\AppData\Local\Temp\ipykernel_116268\147967129.py:3: ImplicitModificationWarning: Trying to modify attribute `.obs` of view, initializing view as actual.
  adata_rearrange.obs['class'] = adata_rearrange.obs['class'].astype(str)
WARNING: Please specify a valid `library_id` or set it permanently in `adata.uns['spatial']`
C:\Users\lshh\miniconda3\envs\py311_torch211_cuda121\Lib\site-packages\squidpy\pl\_spatial_utils.py:946: UserWarning: No data for colormapping provided via 'c'. Parameters 'cmap', 'norm' will be ignored
  _cax = scatter(
[39]:
wt_adata = adata.copy()
ko_adata = adata.copy()
[40]:
pd.Series((wt_adata.X[np.where(ko_adata.obs['class'] == '31 OPC-Oligo')[0]].std(axis=0)/
           wt_adata.X[np.where(ko_adata.obs['class'] == '31 OPC-Oligo')[0]].mean(axis=0)), index=adata.var['gene_symbol']).sort_values()
[40]:
gene_symbol
Sox10      0.298431
Nfix       0.443308
Cldn11     0.455745
Mog        0.514136
Pou3f3     0.569786
            ...
Lhx4      28.757689
Npffr2    28.905586
Fgf3      29.486641
Scgn      29.530397
Hoxb8     30.028955
Length: 1122, dtype: float32
[41]:
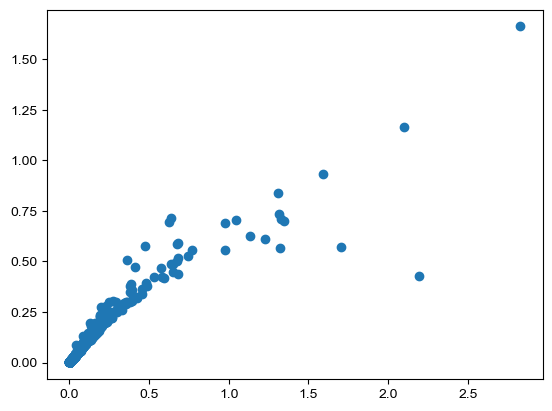
dispersion_df = pd.DataFrame([wt_adata.X[np.where(ko_adata.obs['class'] == '31 OPC-Oligo')[0]].var(axis=0),
             wt_adata.X[np.where(ko_adata.obs['class'] == '31 OPC-Oligo')[0]].mean(axis=0)],
             columns=adata.var['gene_symbol'],
             index=['var', 'mean']).T
dispersion_df['dispersion'] = dispersion_df['var'] / dispersion_df['mean']
dispersion_df = dispersion_df[dispersion_df['mean'] > 1.]
dispersion_df.sort_values('dispersion', ascending=False)
[41]:
| var | mean | dispersion | |
|---|---|---|---|
| gene_symbol | |||
| Grm3 | 0.706748 | 1.044864 | 0.676402 |
| Ermn | 0.840322 | 1.308472 | 0.642216 |
| Cldn11 | 1.662142 | 2.828864 | 0.587565 |
| Sec14l5 | 0.932986 | 1.588670 | 0.587275 |
| Sulf2 | 0.736025 | 1.312926 | 0.560599 |
| Sema6a | 0.627580 | 1.130927 | 0.554925 |
| Mog | 1.162848 | 2.097412 | 0.554421 |
| Zfp536 | 0.711731 | 1.330900 | 0.534774 |
| Gprc5b | 0.698224 | 1.348250 | 0.517874 |
| Zeb2 | 0.613312 | 1.227442 | 0.499667 |
| Pou3f3 | 0.565051 | 1.319265 | 0.428307 |
| Nfix | 0.569929 | 1.702961 | 0.334669 |
| Sox10 | 0.429683 | 2.196494 | 0.195622 |
[42]:
plt.scatter(wt_adata.X[np.where(ko_adata.obs['class'] == '31 OPC-Oligo')[0]].mean(axis=0),
            wt_adata.X[np.where(ko_adata.obs['class'] == '31 OPC-Oligo')[0]].var(axis=0))
[42]:
<matplotlib.collections.PathCollection at 0x174f6c463d0>
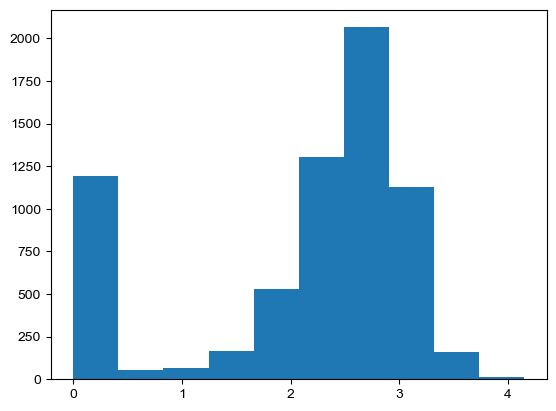
Remove Mog from OPC-Oligo and reconstruct cells
[43]:
ko_gene = 'Mog'

plt.hist(ko_adata.X[np.where(ko_adata.obs['class'] == '31 OPC-Oligo')[0],
         np.where(ko_adata.var['gene_symbol'] == ko_gene)[0][0]])
ko_adata.X[np.where(ko_adata.obs['class'] == '31 OPC-Oligo')[0],
           np.where(ko_adata.var['gene_symbol'] == ko_gene)[0][0]] = 0
ko_dataset = sf.make_dataset([ko_adata], sparse_graph=True, regional_obs=['global'])
sf.tools.calc_obs([ko_adata], ko_dataset, model, get_recon=True)

wt_dataset = sf.make_dataset([wt_adata], sparse_graph=True, regional_obs=['global'])
sf.tools.calc_obs([wt_adata], wt_dataset, model, get_recon=True)
Using ['global'] as regional annotations.
Using ['global'] as regional annotations.
[44]:
gene_rmse = ((ko_adata.obsm['X_recon'] - wt_adata.obsm['X_recon']) ** 2).sum(axis=0) ** .5
[45]:
cell_rmse = ((ko_adata.obsm['X_recon'] - wt_adata.obsm['X_recon']) ** 2).sum(axis=1) ** .5
[46]:
cell_rmse
[46]:
array([0.01820022, 0.04508448, 0.04385628, ..., 0.03686631, 0.04018443,
       0.02311902], dtype=float32)
[47]:
ko_adata.obs['cell_rmse'] = cell_rmse
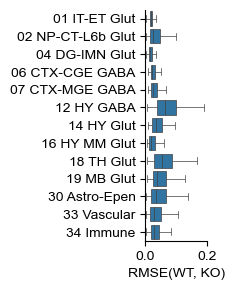
[48]:
fig, ax = plt.subplots(figsize=(.8, 3))
my_obs = ko_adata.obs.copy()
my_obs['class'] = my_obs['class'].tolist()
my_obs = my_obs.sort_values('class')
class_count = my_obs['class'].value_counts()
chosen_classes = class_count[class_count > (class_count.sum()) * 0.005].index.tolist()
chosen_classes.remove('31 OPC-Oligo')
sns.boxplot(my_obs[my_obs['class'].isin(chosen_classes)], y='class', x='cell_rmse',
            fliersize=.0, linewidth=.5, ax=ax)
#ax.set_yticklabels(ax.get_yticklabels(), rotation=30, ha='right', va='top', rotation_mode='anchor')
ax.set_ylabel("")
ax.set_xlabel("RMSE(WT, KO)")
for pos in ['right', 'top']:
    plt.gca().spines[pos].set_visible(False)
plt.xlim([0, .2])
# plt.savefig(savefig_path + "mmbrain_perturbation_cell_mse.pdf", transparent=True, bbox_inches='tight')
[48]:
(0.0, 0.2)
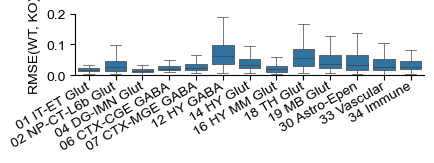
[49]:
fig, ax = plt.subplots(figsize=(4.5, .8))
my_obs = ko_adata.obs.copy()
my_obs['class'] = my_obs['class'].tolist()
my_obs = my_obs.sort_values('class')
class_count = my_obs['class'].value_counts()
chosen_classes = class_count[class_count > (class_count.sum()) * 0.005].index.tolist()
chosen_classes.remove('31 OPC-Oligo')
sns.boxplot(my_obs[my_obs['class'].isin(chosen_classes)], x='class', y='cell_rmse',
            fliersize=.0, linewidth=.5, ax=ax)
#ax.set_yticklabels(ax.get_yticklabels(), rotation=30, ha='right', va='top', rotation_mode='anchor')
ax.set_ylabel("RMSE(WT, KO)")
ax.set_xlabel("")
ax.set_xticklabels(ax.get_xticklabels(), rotation=30, ha='right', va='center', rotation_mode='anchor')
for pos in ['right', 'top']:
    plt.gca().spines[pos].set_visible(False)
plt.ylim([0, .2])
# plt.savefig(savefig_path + "mmbrain_perturbation_cell_mse.pdf", transparent=True, bbox_inches='tight')
C:\Users\lshh\AppData\Local\Temp\ipykernel_116268\945811404.py:13: UserWarning: set_ticklabels() should only be used with a fixed number of ticks, i.e. after set_ticks() or using a FixedLocator.
  ax.set_xticklabels(ax.get_xticklabels(), rotation=30, ha='right', va='center', rotation_mode='anchor')
[49]:
(0.0, 0.2)
[50]:
x = wt_adata.obsm['X_recon'][wt_adata.obs['class'] == '31 OPC-Oligo', :]
y = ko_adata.obsm['X_recon'][ko_adata.obs['class'] == '31 OPC-Oligo', :]
cmp_adata = sc.AnnData(np.vstack([x, y]), var=ko_adata.var.copy())
cmp_adata.var_names = cmp_adata.var['gene_symbol']
cmp_adata.obs['grp'] = ['WT'] * x.shape[0] + ['KO'] * y.shape[0]
sc.tl.rank_genes_groups(cmp_adata, groupby='grp', method='wilcoxon')
cmp_df = sc.get.rank_genes_groups_df(cmp_adata, group="KO")
cmp_df
C:\Users\lshh\miniconda3\envs\py311_torch211_cuda121\Lib\site-packages\numpy\core\fromnumeric.py:86: FutureWarning: The behavior of DataFrame.sum with axis=None is deprecated, in a future version this will reduce over both axes and return a scalar. To retain the old behavior, pass axis=0 (or do not pass axis)
  return reduction(axis=axis, out=out, **passkwargs)
[50]:
| names | scores | logfoldchanges | pvals | pvals_adj | |
|---|---|---|---|---|---|
| 0 | Pif1 | 16.773153 | 0.083190 | 3.835997e-63 | 4.303989e-60 |
| 1 | Diaph3 | 14.955308 | 0.079347 | 1.438155e-50 | 8.068052e-48 |
| 2 | Clspn | 14.882693 | 0.067352 | 4.269589e-50 | 1.596826e-47 |
| 3 | Slfn9 | 14.656121 | 0.064221 | 1.231072e-48 | 3.453157e-46 |
| 4 | Nfib | 13.375875 | 0.069715 | 8.366315e-41 | 1.341001e-38 |
| ... | ... | ... | ... | ... | ... |
| 1117 | Sec14l5 | -11.687506 | -0.152907 | 1.476599e-31 | 8.283721e-30 |
| 1118 | Cldn11 | -12.559337 | -0.239797 | 3.532823e-36 | 3.303190e-34 |
| 1119 | Zfp536 | -13.351248 | -0.143543 | 1.164816e-40 | 1.633655e-38 |
| 1120 | Sox10 | -13.862960 | -0.142347 | 1.062029e-43 | 1.985995e-41 |
| 1121 | 4921534H16Rik | -14.482137 | -0.034744 | 1.571361e-47 | 3.526134e-45 |
1122 rows × 5 columns
[51]:
celltype = '12 HY GABA'
x = wt_adata.obsm['X_recon'][(wt_adata.obs['class'] == celltype), :]
y = ko_adata.obsm['X_recon'][(ko_adata.obs['class'] == celltype), :]
cmp_adata = sc.AnnData(np.vstack([x, y]), var=ko_adata.var.copy())
cmp_adata.var_names = cmp_adata.var['gene_symbol']
cmp_adata.obs['grp'] = ['WT'] * x.shape[0] + ['KO'] * y.shape[0]
sc.tl.rank_genes_groups(cmp_adata, groupby='grp', reference='WT', method='wilcoxon')
cmp_df = sc.get.rank_genes_groups_df(cmp_adata, group="KO")
cmp_df
C:\Users\lshh\miniconda3\envs\py311_torch211_cuda121\Lib\site-packages\numpy\core\fromnumeric.py:86: FutureWarning: The behavior of DataFrame.sum with axis=None is deprecated, in a future version this will reduce over both axes and return a scalar. To retain the old behavior, pass axis=0 (or do not pass axis)
  return reduction(axis=axis, out=out, **passkwargs)
[51]:
| names | scores | logfoldchanges | pvals | pvals_adj | |
|---|---|---|---|---|---|
| 0 | Slc35d3 | 0.756400 | 0.013487 | 0.449409 | 0.999606 |
| 1 | Kirrel | 0.742567 | 0.014942 | 0.457744 | 0.999606 |
| 2 | Sfrp1 | 0.733180 | 0.011120 | 0.463449 | 0.999606 |
| 3 | Satb1 | 0.711935 | 0.017550 | 0.476505 | 0.999606 |
| 4 | Il1rap | 0.702054 | 0.010552 | 0.482645 | 0.999606 |
| ... | ... | ... | ... | ... | ... |
| 1117 | Tspear | -0.681304 | -0.015128 | 0.495679 | 0.999606 |
| 1118 | Tnc | -0.696125 | -0.024466 | 0.486350 | 0.999606 |
| 1119 | Pappa2 | -0.729721 | -0.018365 | 0.465561 | 0.999606 |
| 1120 | Pax3 | -0.729721 | -0.021977 | 0.465561 | 0.999606 |
| 1121 | Irx5 | -0.852247 | -0.019905 | 0.394077 | 0.999606 |
1122 rows × 5 columns
GSEA on DEs
[52]:
import gseapy
from gseapy import Msigdb

msig = Msigdb()
gmt = msig.get_gmt(category='c5.go.bp', dbver="2024.1.Hs")
C:\Users\lshh\miniconda3\envs\py311_torch211_cuda121\Lib\site-packages\gseapy\msigdb.py:20: FutureWarning: Passing literal html to 'read_html' is deprecated and will be removed in a future version. To read from a literal string, wrap it in a 'StringIO' object.
  d = pd.read_html(resp.text)[0]
C:\Users\lshh\miniconda3\envs\py311_torch211_cuda121\Lib\site-packages\gseapy\msigdb.py:72: FutureWarning: Passing literal html to 'read_html' is deprecated and will be removed in a future version. To read from a literal string, wrap it in a 'StringIO' object.
  d = pd.read_html(resp.text)[0]
[53]:
gene_df = cmp_df.copy()
gene_df.index = cmp_df['names'].str.upper()

gsea_res = gseapy.prerank(rnk=gene_df['scores'], # or rnk = rnk,
                          gene_sets=gmt,
                          threads=5,
                          min_size=5,
                          max_size=1000,
                          permutation_num=1000, # reduce number to speed up testing
                          outdir=None, # don't write to disk
                          seed=0,
                          verbose=True, # see what's going on behind the scenes
                          )

grea_res_selected = gsea_res.res2d[(gsea_res.res2d['NOM p-val'] < 0.01) & (gsea_res.res2d['FDR q-val'] < 0.2)]
2025-03-03 17:52:50,598 [WARNING] Duplicated values found in preranked stats: 36.36% of genes
The order of those genes will be arbitrary, which may produce unexpected results.
2025-03-03 17:52:50,598 [INFO] Parsing data files for GSEA.............................
2025-03-03 17:52:50,688 [INFO] 5396 gene_sets have been filtered out when max_size=1000 and min_size=5
2025-03-03 17:52:50,689 [INFO] 2212 gene_sets used for further statistical testing.....
2025-03-03 17:52:50,690 [INFO] Start to run GSEA...Might take a while..................
2025-03-03 17:52:55,533 [INFO] Congratulations. GSEApy runs successfully................
[54]:
grea_res_selected
[54]:
| Name | Term | ES | NES | NOM p-val | FDR q-val | FWER p-val | Tag % | Gene % | Lead_genes | |
|---|---|---|---|---|---|---|---|---|---|---|
| 0 | prerank | GOBP_TELENCEPHALON_DEVELOPMENT | 0.482072 | 2.151512 | 0.0 | 0.0786 | 0.048 | 33/58 | 31.37% | SLC32A1;ARX;ERBB4;DLX2;LHX6;BCL11B;OXTR;NR2E1;... |
| 1 | prerank | GOBP_PALLIUM_DEVELOPMENT | 0.546905 | 2.149917 | 0.0 | 0.039896 | 0.049 | 19/34 | 23.71% | SLC32A1;ARX;DLX2;LHX6;NR2E1;PROX1;DRD1;EGFR;AL... |
| 2 | prerank | GOBP_REGULATION_OF_ORGAN_GROWTH | 0.725254 | 2.047186 | 0.001608 | 0.106388 | 0.16 | 7/11 | 7.13% | ARX;ERBB4;COL14A1;IGF1;ZFPM2;PROX1;RBP4 |
| 3 | prerank | GOBP_FOREBRAIN_DEVELOPMENT | 0.419623 | 2.040435 | 0.0 | 0.086937 | 0.172 | 45/91 | 29.06% | SLC32A1;ARX;ERBB4;DLX2;LHX6;BCL11B;SOX2;LHX8;O... |
| 4 | prerank | GOBP_CEREBRAL_CORTEX_CELL_MIGRATION | 0.676108 | 2.031769 | 0.0 | 0.0786 | 0.196 | 8/13 | 22.37% | ARX;LHX6;NR2E1;EGFR;RELN;FGF13;SLIT2;POU3F3 |
| 5 | prerank | GOBP_FOREBRAIN_GENERATION_OF_NEURONS | 0.572954 | 1.984345 | 0.0 | 0.131596 | 0.355 | 11/21 | 18.81% | DLX2;LHX6;BCL11B;LHX8;NR2E1;PROX1;SOX1;GATA2;N... |
| 6 | prerank | GOBP_HIPPOCAMPUS_DEVELOPMENT | 0.591436 | 1.956173 | 0.0 | 0.163665 | 0.457 | 11/19 | 18.63% | SLC32A1;DLX2;NR2E1;PROX1;DRD1;ALK;RELN;FGF13;Z... |
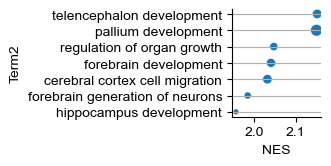
[55]:
def func(x):
    x = x[5:]
    return x.replace('_', ' ').lower()
grea_res_selected['Term2'] = grea_res_selected['Term'].apply(func)
C:\Users\lshh\AppData\Local\Temp\ipykernel_116268\2450731809.py:4: SettingWithCopyWarning:
A value is trying to be set on a copy of a slice from a DataFrame.
Try using .loc[row_indexer,col_indexer] = value instead

See the caveats in the documentation: https://pandas.pydata.org/pandas-docs/stable/user_guide/indexing.html#returning-a-view-versus-a-copy
  grea_res_selected['Term2'] = grea_res_selected['Term'].apply(func)
[56]:
grea_res_selected['-log(q)'] = -np.log10(grea_res_selected['FDR q-val'].astype(float))
fig = sns.relplot(grea_res_selected, y='Term2', x='NES', size='-log(q)', legend=False)
plt.gcf().set_size_inches(1.8, 1.25)
plt.grid(axis='y', zorder=0)
# plt.savefig(savefig_path + "mmbrain_perturbation_go.pdf", transparent=True, bbox_inches='tight')
C:\Users\lshh\AppData\Local\Temp\ipykernel_116268\2706694812.py:1: SettingWithCopyWarning:
A value is trying to be set on a copy of a slice from a DataFrame.
Try using .loc[row_indexer,col_indexer] = value instead

See the caveats in the documentation: https://pandas.pydata.org/pandas-docs/stable/user_guide/indexing.html#returning-a-view-versus-a-copy
  grea_res_selected['-log(q)'] = -np.log10(grea_res_selected['FDR q-val'].astype(float))
[ ]: