Ovarian cancer data analysis
Train steamboat model on HGSC data.
[27]:
import os
import scanpy as sc
import squidpy as sq
import numpy as np
import scipy as sp
import seaborn as sns
import pandas as pd
import matplotlib.pyplot as plt
[2]:
plt.rcParams['pdf.fonttype'] = 42
plt.rcParams['mathtext.fontset'] = 'dejavuserif'
plt.rcParams['font.family'] = 'arial'

pltkw = dict(bbox_inches='tight', transparent=True)
[3]:
import sys
sys.path.append("..")
import steamboat as sf
import steamboat.tools
import torch
device = 'cuda'
[37]:
import importlib
importlib.reload(steamboat.tools)
[37]:
<module 'steamboat.tools' from 'G:\\Projects\\Steamboat\\examples\\..\\steamboat\\tools.py'>
[5]:
# https://www.nature.com/articles/s41590-024-01943-5
Load data
[6]:
regenerate = False

h5ad_file = "../../../data/HGSC/ST_Discovery_so.h5ad"
if (not os.path.exists(h5ad_file)) or regenerate:
    adata = sc.read_mtx("G:/data/HGSC/Csv/ST_Discovery_so_counts.mtx").T
    metadata = pd.read_csv("G:/data/HGSC/Csv/ST_Discovery_so_metadata.csv", index_col=0)
    features = pd.read_csv("G:/data/HGSC/Csv/ST_Discovery_so_features.txt", index_col=0, header=None)
    features.index = features.index.str.strip() # remove trailing white space in gene names
    features.index.name = 'gene_symbol'
    adata.obs = metadata
    adata.var = features
    adata.obsm['spatial'] = adata.obs[['x', 'y']].to_numpy()
    adata.write_h5ad("G:/data/HGSC/h5ad/ST_Discovery_so.h5ad")
else:
    adata = sc.read_h5ad(h5ad_file)
[7]:
adata.obs
[7]:
| orig.ident | nCount_RNA | nFeature_RNA | samples | patients | sites_binary | cell.types | cell.subtypes | x | y | |
|---|---|---|---|---|---|---|---|---|---|---|
| SMI_T10_F001_c1017 | SMI | 848 | 357 | SMI_T10_F001 | HGSC1 | Adnexa | Malignant | Malignant | 1493.3500 | 3151.233 |
| SMI_T10_F001_c102 | SMI | 731 | 319 | SMI_T10_F001 | HGSC1 | Adnexa | Malignant | Malignant | 2623.2000 | 3607.450 |
| SMI_T10_F001_c1062 | SMI | 236 | 155 | SMI_T10_F001 | HGSC1 | Adnexa | Malignant | Malignant | 850.5670 | 3143.833 |
| SMI_T10_F001_c1064 | SMI | 609 | 300 | SMI_T10_F001 | HGSC1 | Adnexa | Malignant | Malignant | 3222.7300 | 3152.586 |
| SMI_T10_F001_c1075 | SMI | 310 | 174 | SMI_T10_F001 | HGSC1 | Adnexa | Malignant | Malignant | 78.0125 | 3179.012 |
| ... | ... | ... | ... | ... | ... | ... | ... | ... | ... | ... |
| SMI_T14_F020_c5758 | SMI | 100 | 63 | SMI_T14_F020 | HGSC89 | Omentum | TNK.cell | CD4.T.cell.DN | 5170.4400 | 431.900 |
| SMI_T14_F020_c734 | SMI | 141 | 88 | SMI_T14_F020 | HGSC89 | Omentum | Fibroblast | Fibroblast | 768.7000 | 3188.400 |
| SMI_T14_F020_c875 | SMI | 78 | 60 | SMI_T14_F020 | HGSC89 | Omentum | Malignant | Malignant | 42.5833 | 3070.350 |
| SMI_T14_F020_c3288 | SMI | 104 | 58 | SMI_T14_F020 | HGSC89 | Omentum | Fibroblast | Fibroblast | 48.9889 | 1751.740 |
| SMI_T14_F020_c2963 | SMI | 102 | 54 | SMI_T14_F020 | HGSC89 | Omentum | Monocyte | Monocyte | 3696.3000 | 1917.450 |
491792 rows × 10 columns
[8]:
## Metadata and gene sets

sample_metadata = pd.read_excel("../../../data/HGSC/sample_metadata.xlsx", index_col=0, sheet_name='Table 2b', skiprows=1)
sample_metadata = sample_metadata[sample_metadata['dataset'] == 'Discovery']

celltype_signatures = pd.read_excel("G:/data/HGSC/sample_metadata.xlsx", sheet_name='Table 3a', skiprows=2)
mtil_signautures = pd.read_excel("G:/data/HGSC/sample_metadata.xlsx", sheet_name='Table 6a', skiprows=2)
desmoplasia_signautures = pd.read_excel("G:/data/HGSC/sample_metadata.xlsx", sheet_name='Table 5a', skiprows=2)

def purge_gene_sets(df, prefix=''):
    res = {}
    for i in df.columns:
        res[prefix + i] = df[i].dropna().tolist()
    return res
celltype_signatures = pd.read_excel("G:/data/HGSC/sample_metadata.xlsx", index_col=0, sheet_name='Table 3b', skiprows=2).iloc[:, :-3]
genesets = (purge_gene_sets(celltype_signatures, 'sig_') |
            purge_gene_sets(mtil_signautures, 'mtil_') |
            purge_gene_sets(mtil_signautures, 'mtil_'))
genesets.keys()
del genesets['sig_Mast.cell']

sample_metadata
[8]:
| dataset | platform | n_cells | median_tpc | mean_tpc | TMA | patients | sites_binary | age | stage | ... | fu_time2 | outcome | pfs | BRCA1_Somatic | BRCA2_Somatic | TP53_Somatic | BRCA1_Germline | BRCA2_Germline | TP53_Germline | tmb | |
|---|---|---|---|---|---|---|---|---|---|---|---|---|---|---|---|---|---|---|---|---|---|
| profile | |||||||||||||||||||||
| SMI_T10_F001 | Discovery | SMI | 5660 | 205.0 | 238.675618 | TMA 10 | HGSC1 | Adnexa | 58.0 | III | ... | 775.0 | Alive | 775.0 | WT | P | P | US | US | US | 6.80 |
| SMI_T10_F002 | Discovery | SMI | 8821 | 364.0 | 393.318671 | TMA 10 | HGSC7 | Adnexa | 58.0 | III | ... | 1013.0 | Alive | 1013.0 | P | WT | LP | US | US | US | 0.53 |
| SMI_T10_F003 | Discovery | SMI | 2881 | 300.0 | 445.154460 | TMA 10 | HGSC8 | Adnexa | 65.0 | IV | ... | 781.0 | Alive | 200.0 | WT | WT | P | US | US | US | 3.16 |
| SMI_T10_F004 | Discovery | SMI | 3145 | 286.0 | 376.895390 | TMA 10 | HGSC13 | Omentum | 67.0 | III | ... | 840.0 | Dead (disease) | 161.0 | WT | WT | P | US | US | US | 2.63 |
| SMI_T10_F005 | Discovery | SMI | 2187 | 165.0 | 267.202561 | TMA 10 | HGSC15 | Adnexa | 33.0 | IV | ... | 845.0 | Alive | 845.0 | WT | WT | P | P | US | US | 2.63 |
| ... | ... | ... | ... | ... | ... | ... | ... | ... | ... | ... | ... | ... | ... | ... | ... | ... | ... | ... | ... | ... | ... |
| SMI_T14_F016 | Discovery | SMI | 2744 | 209.0 | 288.211735 | TMA 14 | HGSC61 | Omentum | 70.0 | III | ... | 1955.0 | Alive | 1955.0 | WT | WT | P | US | US | US | 1.10 |
| SMI_T14_F017 | Discovery | SMI | 3376 | 276.0 | 368.816647 | TMA 14 | HGSC63 | Omentum | 71.0 | III | ... | 407.0 | D/c to hospice (likely dead of disease) | 297.0 | WT | WT | P | US | US | US | 0.50 |
| SMI_T14_F018 | Discovery | SMI | 9961 | 189.0 | 210.500452 | TMA 14 | HGSC89 | Adnexa | 53.0 | III | ... | 1729.0 | Dead (disease) | 412.0 | NaN | NaN | NaN | NaN | NaN | NaN | NaN |
| SMI_T14_F019 | Discovery | SMI | 3298 | 205.0 | 271.453305 | TMA 14 | HGSC91 | Adnexa | 67.0 | III | ... | 1925.0 | D/c to hospice (likely dead of disease) | 867.0 | WT | WT | P | US | US | US | 0.50 |
| SMI_T14_F020 | Discovery | SMI | 6214 | 381.0 | 406.158191 | TMA 14 | HGSC89 | Omentum | 53.0 | III | ... | 1729.0 | Dead (disease) | 412.0 | NaN | NaN | NaN | NaN | NaN | NaN | NaN |
100 rows × 25 columns
[9]:
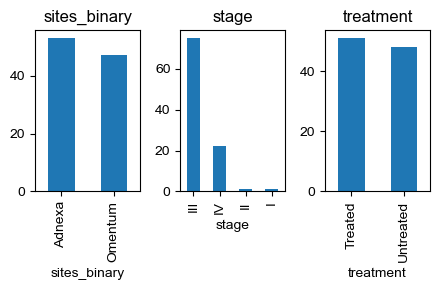
## Find untreated, adnexa samples

columns_of_interest = ['sites_binary', 'stage', 'treatment']
fig, axes = plt.subplots(1, len(columns_of_interest), figsize=(len(columns_of_interest) * 1.5, 3))
for i, column in enumerate(columns_of_interest):
    sample_metadata[column].value_counts().plot(kind='bar', ax=axes[i])
    axes[i].set_title(column)
plt.tight_layout()

mask = (sample_metadata['sites_binary'] == 'Adnexa') & (sample_metadata['treatment'] == 'Untreated')
samples_of_interest = sample_metadata.index[mask].tolist()

all_adata = adata[adata.obs['samples'].isin(samples_of_interest)].copy()
all_adata.obs['cell.types.nolc'] = all_adata.obs['cell.types'].str.replace('_LC', '')
[10]:
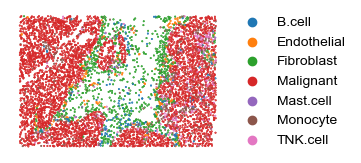
### Have a look at the spatial distribution of cells
Train a Steamboat model
Process data to create torch dataset
[12]:
# Separate individual slides
adatas = []
for i in all_adata.obs['samples'].unique():
    temp = all_adata[all_adata.obs['samples'] == i].copy()
    if temp.shape[0] < 100:
        continue
    adatas.append(temp)
    adatas[-1].obs['global'] = 0

# normalize and log transformation
adatas = sf.prep_adatas(adatas, norm=True, log1p=True, scale=False, renorm=False)

# create torch dataset
dataset = sf.make_dataset(adatas, sparse_graph=True, regional_obs=['global'])
Using ['global'] as regional annotations.
[13]:
sq.pl.spatial_scatter(adatas[0], color=['cell.types.nolc'], shape=None, figsize=(3.5, 3.5), size=.5,
                      legend_fontsize=10, cmap='Reds', ncols=3, colorbar=False, vmin=0., wspace=.0, outline=False, frameon=False, title="")
WARNING: Please specify a valid `library_id` or set it permanently in `adata.uns['spatial']`
C:\Users\lshh\miniconda3\envs\py311_torch211_cuda121\Lib\site-packages\squidpy\pl\_spatial_utils.py:946: UserWarning: No data for colormapping provided via 'c'. Parameters 'cmap', 'norm' will be ignored
  _cax = scatter(
[14]:
# Move data into vmem

cuda_dataset = None

load_data_into_gpu = True # if you run into OOM on GPU, set this to False
if device == 'cuda' and load_data_into_gpu:
    cuda_dataset = dataset.to('cuda')
Create model and train
[15]:
n_heads = 25

sf.set_random_seed(0)
model = sf.Steamboat(adata.var_names.tolist(), n_heads=n_heads, n_scales=3)
model = model.to(device)

use_dataset = cuda_dataset
if use_dataset is None:
    use_dataset = dataset

model.fit(cuda_dataset, entry_masking_rate=0.1, feature_masking_rate=0.1,
          max_epoch=10000,
          loss_fun=torch.nn.MSELoss(reduction='sum'),
          opt=torch.optim.Adam, opt_args=dict(lr=0.1), stop_eps=1e-3, report_per=200, stop_tol=200, device=device)
[2025-03-02 16:34:31,571::train::INFO] Epoch 1: train_loss 108.29949
[2025-03-02 16:34:52,082::train::INFO] Epoch 201: train_loss 65.23699
[2025-03-02 16:35:13,249::train::INFO] Epoch 401: train_loss 64.43046
[2025-03-02 16:35:35,547::train::INFO] Epoch 601: train_loss 64.02565
[2025-03-02 16:35:58,622::train::INFO] Epoch 801: train_loss 63.11885
[2025-03-02 16:36:21,533::train::INFO] Epoch 1001: train_loss 62.52837
[2025-03-02 16:36:43,575::train::INFO] Epoch 1201: train_loss 61.90503
[2025-03-02 16:37:05,656::train::INFO] Epoch 1401: train_loss 61.92073
[2025-03-02 16:37:26,926::train::INFO] Epoch 1601: train_loss 61.44772
[2025-03-02 16:37:48,203::train::INFO] Epoch 1801: train_loss 61.36187
[2025-03-02 16:38:09,090::train::INFO] Epoch 2001: train_loss 61.31289
[2025-03-02 16:38:31,168::train::INFO] Epoch 2201: train_loss 61.13449
[2025-03-02 16:38:52,523::train::INFO] Epoch 2401: train_loss 61.05229
[2025-03-02 16:39:13,759::train::INFO] Epoch 2601: train_loss 61.05418
[2025-03-02 16:39:18,513::train::INFO] Epoch 2647: train_loss 61.26666
[2025-03-02 16:39:18,513::train::INFO] Stopping criterion met.
[15]:
Steamboat(
  (spatial_gather): BilinearAttention(
    (bias): NonNegBias(
      (elu): ELU(alpha=1.0)
    )
    (q): NonNegLinear(
      (elu): ELU(alpha=1.0)
    )
    (k_local): NonNegLinear(
      (elu): ELU(alpha=1.0)
    )
    (k_regionals): ModuleList(
      (0): NonNegLinear(
        (elu): ELU(alpha=1.0)
      )
    )
    (w_ego): NonNegScale(
      (elu): ELU(alpha=1.0)
    )
    (tanh): Tanh()
    (v): NonNegLinear(
      (elu): ELU(alpha=1.0)
    )
    (cosine_similarity): CosineSimilarity()
  )
)
Save model
[16]:
torch.save(model.state_dict(), 'saved_models/hgsc.pth')
Calculate attention scores and save AnnData
[17]:
sf.tools.calc_obs(adatas, dataset, model, get_recon=True)
sf.tools.gather_obs(all_adata, adatas)
[18]:
all_adata.write_h5ad("saved_h5ad/hgsc.h5ad")
[19]:
# Embedding for cell-cell interaction?
# Could there be two pairs of cell types with similar interaction?
# E.g.???
[22]:
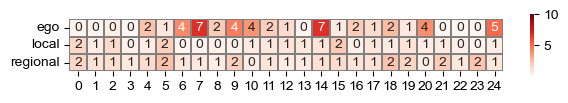
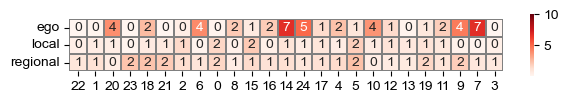
head_weights = sf.tools.calc_head_weights(adatas, model)
sf.tools.plot_head_weights(head_weights)
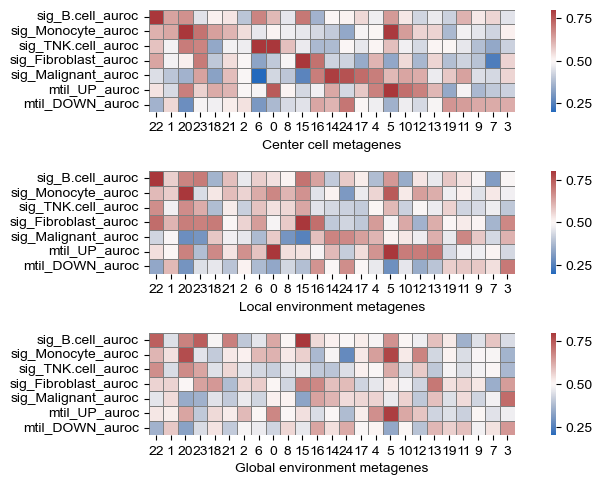
Metagene interpretation: cell types and states
[23]:
gene_df = sf.tools.calc_var(model)
sig_df = sf.tools.calc_geneset_auroc(gene_df, genesets)
metagene_order = sf.tools.calc_geneset_auroc_order(sig_df)
sf.tools.plot_geneset_auroc(sig_df, metagene_order)
[23]:
(<Figure size 800x500 with 6 Axes>,
 <Axes: xlabel='Global environment metagenes'>)
[24]:
sf.tools.plot_head_weights(head_weights, 100, metagene_order)
[25]:
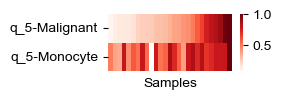
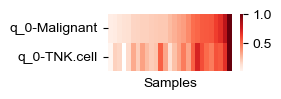
def plot_helper(all_adata, i_head, celltypes):
    plt_df = all_adata.obs.copy()
    plt_df[f'q_{i_head}'] = all_adata.obsm['q'][:, i_head]
    plt_df = plt_df[plt_df['cell.types.nolc'].isin(celltypes)]
    plt_df = pd.pivot_table(plt_df, index=["samples"], columns=["cell.types.nolc"], values=[f"q_{i_head}"], aggfunc=np.median)
    plt_df = plt_df.sort_values(by=(f"q_{i_head}", celltypes[0]))

    fig, ax = plt.subplots(figsize=(2, 0.75))
    sns.heatmap((plt_df / plt_df.max()).T, ax=ax, cmap='Reds')
    ax.set_xticks([])
    ax.set_ylabel('')
    ax.set_xlabel('Samples')

plot_helper(all_adata, 5, ['Malignant', 'Monocyte'])
plot_helper(all_adata, 0, ['Malignant', 'TNK.cell'])
C:\Users\lshh\AppData\Local\Temp\ipykernel_18608\3279536217.py:5: FutureWarning: The provided callable <function median at 0x0000020F95881580> is currently using DataFrameGroupBy.median. In a future version of pandas, the provided callable will be used directly. To keep current behavior pass the string "median" instead.
  plt_df = pd.pivot_table(plt_df, index=["samples"], columns=["cell.types.nolc"], values=[f"q_{i_head}"], aggfunc=np.median)
[28]:
# investigate the overlap between Mtil and Monocyte (Up)
# This part is completely from the original publication.
# It has nothing to do with Steamboat
immune_til = pd.read_excel("G:/data/HGSC/sample_metadata.xlsx", index_col=None, sheet_name='Table 4a', skiprows=1)
immune_til = purge_gene_sets(immune_til)
immune_genes = set()
for k, v in immune_til.items():
    if 'Up' in k:
        immune_genes |= set(v)

# Define the parameters of the test
M = all_adata.shape[1]  # Total population size
n = len(set(genesets['mtil_UP']))  # Number of successes in the population
N = len(immune_til['Monocyte (Up)'])   # Sample size
k = len(set(genesets['mtil_UP']) & set(immune_til['Monocyte (Up)']))   # Number of successes in the sample

# Calculate the p-value
p_value = sp.stats.hypergeom.sf(k-1, M, n, N)

print("P-value:", p_value)
P-value: 2.824042372846463e-06
Attention map interpretation: Cell-cell interaction
[38]:
steamboat_cci = sf.tools.calc_interaction(adatas, model, 'samples', 'cell.types.nolc')
adjacency_cci = sf.tools.calc_adjacency_freq(adatas, 'samples', 'cell.types.nolc')
[46]:
def melt_helper(x):
    x_melt = x.melt(ignore_index=False)
    x_melt['variable'] = x_melt.index + '_' + x_melt['variable']
    return x_melt

cellchat_corr_dict = {}
cellchat_melt_dict = {}

cellchat_dict = {}

for k, v in steamboat_cci.items():
    cellchat_res_path = f"../data/Ex1_hgsc/cellchat/{k}.csv"
    if os.path.isfile(cellchat_res_path):
        # print(cellchat_res_path)
        cellchat = pd.read_csv(cellchat_res_path, index_col=0)
        if (cellchat == 0).all().all():
            print(cellchat_res_path, 'all zero. Ignore.')
            continue

        cellchat_dict[k] = cellchat
        mine = v.copy()
        cellchat_melt = melt_helper(cellchat + cellchat.T)
        mine_melt = melt_helper(mine)

        adjacency_melt = melt_helper(adjacency_cci[k])
        adjacency_melt.columns = ['variable', 'value_adjacency']

        all_melt = pd.merge(cellchat_melt, mine_melt, on='variable', suffixes=['_cellchat', '_steamboat'])
        all_melt = pd.merge(all_melt, adjacency_melt, on='variable')

        corr_res = sp.stats.spearmanr(all_melt['value_cellchat'], all_melt['value_steamboat'])
        cellchat_melt_dict[k] = all_melt
        cellchat_corr_dict[k] = [corr_res.statistic, corr_res.pvalue]

        corr_res = sp.stats.spearmanr(all_melt['value_cellchat'], all_melt['value_adjacency'])
        cellchat_corr_dict[k].extend([corr_res.statistic, corr_res.pvalue])
    else:
        print(cellchat_res_path, 'not found!')

cellchat_corr_df = pd.DataFrame(cellchat_corr_dict, index=['steamboat_r', 'steamboat_p',
                                                           'adjacency_r', 'adjacency_p'])

cellchat_corr_df = cellchat_corr_df.T
cellchat_corr_df
../data/Ex1_hgsc/cellchat/SMI_T11_F011.csv all zero. Ignore.
[46]:
| steamboat_r | steamboat_p | adjacency_r | adjacency_p | |
|---|---|---|---|---|
| SMI_T10_F001 | 0.755135 | 3.632222e-10 | 0.429699 | 2.061229e-03 |
| SMI_T10_F002 | 0.670874 | 7.548447e-06 | 0.575617 | 2.397048e-04 |
| SMI_T10_F006 | 0.888415 | 1.658203e-17 | 0.540967 | 5.991565e-05 |
| SMI_T10_F014 | 0.838586 | 5.474576e-14 | 0.658272 | 2.739395e-07 |
| SMI_T11_F001 | 0.772195 | 8.180797e-11 | 0.561502 | 2.698830e-05 |
| SMI_T11_F002 | 0.827573 | 2.270243e-13 | 0.729006 | 2.858394e-09 |
| SMI_T11_F004 | 0.787767 | 1.867813e-11 | 0.643418 | 6.153603e-07 |
| SMI_T11_F008 | 0.603095 | 9.896973e-05 | 0.190274 | 2.663338e-01 |
| SMI_T11_F009 | 0.884087 | 8.915730e-13 | 0.432830 | 8.372754e-03 |
| SMI_T11_F020 | 0.805471 | 2.977523e-12 | 0.589490 | 8.326015e-06 |
| SMI_T12_F005 | 0.604900 | 9.311499e-05 | 0.182287 | 2.872978e-01 |
| SMI_T12_F007 | 0.758440 | 2.747354e-10 | 0.559322 | 2.944682e-05 |
| SMI_T12_F009 | 0.850677 | 5.052671e-11 | 0.485829 | 2.665902e-03 |
| SMI_T12_F013 | 0.729424 | 4.499990e-07 | 0.603282 | 9.834826e-05 |
| SMI_T12_F015 | 0.861841 | 1.852292e-15 | 0.352276 | 1.304941e-02 |
| SMI_T12_F018 | 0.885827 | 2.759605e-17 | 0.741150 | 1.129690e-09 |
| SMI_T13_F005 | 0.820789 | 5.191639e-13 | 0.526868 | 1.006035e-04 |
| SMI_T13_F009 | 0.873760 | 2.548901e-16 | 0.708375 | 1.241620e-08 |
| SMI_T13_F011 | 0.502772 | 1.777324e-03 | 0.154748 | 3.674999e-01 |
| SMI_T13_F018 | 0.586634 | 1.697411e-04 | 0.492009 | 2.304903e-03 |
| SMI_T13_F019 | 0.618571 | 2.171170e-06 | 0.512954 | 1.641370e-04 |
| SMI_T14_F002 | 0.724049 | 6.002924e-07 | 0.219903 | 1.975029e-01 |
| SMI_T14_F005 | 0.862140 | 1.425636e-11 | 0.720954 | 7.065192e-07 |
| SMI_T14_F015 | 0.675187 | 6.266207e-06 | 0.542780 | 6.256654e-04 |
| SMI_T14_F018 | 0.347490 | 8.875412e-02 | 0.484102 | 1.420283e-02 |
| SMI_T14_F019 | 0.849894 | 5.487522e-11 | 0.491510 | 2.332352e-03 |
[47]:
# fig, ax = plt.subplots(figsize=(2, 2))
# cellchat_corr_df.plot(kind='scatter', x='normneigh_r', y='steamboat_r', ax=ax)
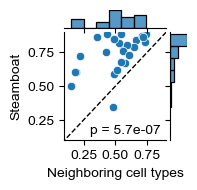
g = sns.jointplot(
data=cellchat_corr_df,
x="adjacency_r", y="steamboat_r",
kind="scatter",
height=2,
xlim=[0.1, .9],
ylim=[0.1, .9]
)
ax = g.ax_joint
ax.set_xlabel('Neighboring cell types')
ax.set_ylabel('Steamboat')
ax.plot([.0, 1.], [.0, 1.], ls='--', lw=1., c='k')
test_res = sp.stats.wilcoxon(cellchat_corr_df['adjacency_r'], cellchat_corr_df['steamboat_r'])
ax.text(0.3, 0.15, f'p = {test_res.pvalue:.1e}')
(cellchat_corr_df['adjacency_r'] < cellchat_corr_df['steamboat_r']).sum() / cellchat_corr_df.shape[0]
# for pos in ['right', 'top']:
# ax.spines[pos].set_visible(False)
# g.savefig("C:/Users/lshh/OneDrive/Publications/Steamboat/pub/fig-hgsc-elements/steamboat_vs_adjacency.pdf", **pltkw)
[47]:
0.9615384615384616
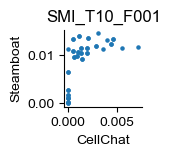
[48]:
sample = 'SMI_T10_F001'
fig, ax = plt.subplots(figsize=(1., 1.))
cellchat_melt_dict[sample].plot(kind='scatter', x='value_cellchat', y='value_steamboat', ax=ax, title=sample, s=5.)
ax.set_xlabel('CellChat')
ax.set_ylabel('Steamboat')
for pos in ['right', 'top']:
plt.gca().spines[pos].set_visible(False)
fig.savefig(f"C:/Users/lshh/OneDrive/Publications/Steamboat/pub/fig-hgsc-elements/steamboat_{sample}.pdf", **pltkw)
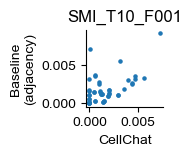
fig, ax = plt.subplots(figsize=(1., 1.))
cellchat_melt_dict[sample].plot(kind='scatter', x='value_cellchat', y='value_adjacency', ax=ax, title=sample, s=5.)
ax.set_xlabel('CellChat')
ax.set_ylabel('Baseline\n(adjacency)')
for pos in ['right', 'top']:
plt.gca().spines[pos].set_visible(False)
fig.savefig(f"C:/Users/lshh/OneDrive/Publications/Steamboat/pub/fig-hgsc-elements/adjacency_{sample}.pdf", **pltkw)
Misc visuals
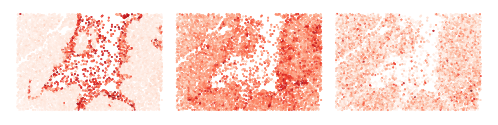
Visualize cell scores from head #0, #5, #15
[54]:
for i_head in [0, 5, 15]:
    adatas[0].obs[f'q_{i_head}'] = adatas[0].obsm['q'][:, i_head]
    adatas[0].obs[f'local_k_{i_head}'] = adatas[0].obsm['local_k'][:, i_head]
    adatas[0].obs[f'global_k_0_{i_head}'] = adatas[0].obsm['global_k_0'][:, i_head]
    sq.pl.spatial_scatter(adatas[0], color=[f'q_score_{i_head}', f'local_k_{i_head}', f'global_k_0_{i_head}'], shape=None, figsize=(2, 2), size=.5,
                          legend_fontsize=10, cmap='Reds', ncols=3, colorbar=False, vmin=0., wspace=.0, outline=False, frameon=False, title="")
WARNING: Please specify a valid `library_id` or set it permanently in `adata.uns['spatial']`
WARNING: Please specify a valid `library_id` or set it permanently in `adata.uns['spatial']`
WARNING: Please specify a valid `library_id` or set it permanently in `adata.uns['spatial']`


Print top ranked genes in head #15
[55]:
k15 = pd.Series(model.spatial_gather.k_regionals[0].weight[15, :].detach().cpu().numpy().tolist(), index=model.features).sort_values(ascending=False)
print(*k15[:20].index, sep=' ')
AGR2 GDF15 COL9A1 CEACAM6 PGR PLAC8 MMP8 KRT5 DDIT3 PROK2 COL5A3 MMP7 IFIH1 DDR2 MAML2 ITGAV NLRP2 TUBB4B LAMP3 INHBA
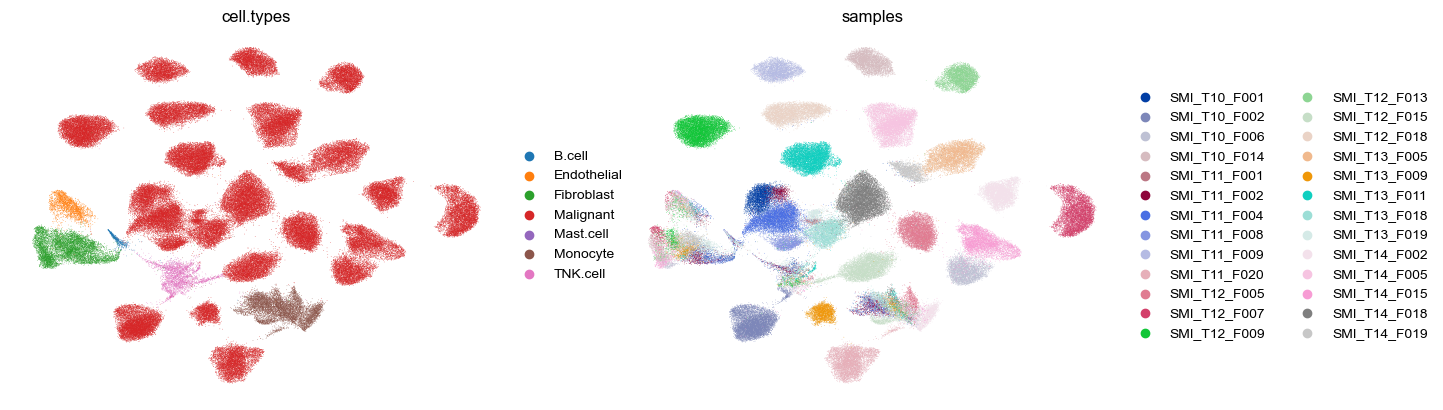
UMAP of cell embeddings
[57]:
adata = all_adata[~all_adata.obs['cell.types'].str.contains('_LC')]
adata.obsm['std_attn'] = adata.obsm['attn'] / adata.obsm['attn'].std(axis=0, keepdims=True)
sc.pp.neighbors(adata, use_rep='std_attn', key_added='sf', metric='cosine')
sc.tl.umap(adata, neighbors_key='sf')
[59]:
sc.pl.umap(adata, color=['cell.types', 'samples'], frameon=False)
C:\Users\lshh\miniconda3\envs\py311_torch211_cuda121\Lib\site-packages\scanpy\plotting\_tools\scatterplots.py:1251: FutureWarning: The default value of 'ignore' for the `na_action` parameter in pandas.Categorical.map is deprecated and will be changed to 'None' in a future version. Please set na_action to the desired value to avoid seeing this warning
  color_vector = pd.Categorical(values.map(color_map))
C:\Users\lshh\miniconda3\envs\py311_torch211_cuda121\Lib\site-packages\scanpy\plotting\_tools\scatterplots.py:394: UserWarning: No data for colormapping provided via 'c'. Parameters 'cmap' will be ignored
  cax = scatter(
[ ]: